3 Item and Test Development
Chapter 3 of the 2015–2016 Technical Manual—Science (Dynamic Learning Maps Consortium, 2017) describes item and test development procedures. This chapter provides an overview of updates to item and test development for the 2019–2020 academic year. The first portion of the chapter provides an overview of an evaluation of science testlet engagement activities, 2019–2020 item writers’ characteristics, followed by the 2019–2020 external review of items, testlets, and texts based on criteria centered around content, bias, and accessibility. The next portion of the chapter describes the pool of operational and field test testlets available for administration during 2019–2020.
For a complete description of item and test development for DLM assessments, including information on the use of evidence-centered design and Universal Design for Learning in the creation of concept maps to guide test development; external review of content; and information on the pool of items available for the pilot, field tests, and 2015–2016 administration, see the 2015–2016 Technical Manual—Science (Dynamic Learning Maps Consortium, 2017).
3.1 Items and Testlets
This section describes information pertaining to items and testlets administered as part of the DLM assessment system, including an evaluation of science testlet engagement activites and a brief summary of the item writer demographics and duties for the 2019–2020 year. For a complete summary of item and testlet development procedures that began in 2015–2016 and were implemented through 2019–2020, see Chapter 3 of the 2015–2016 Technical Manual—Science (Dynamic Learning Maps Consortium, 2017).
3.1.1 Science Testlet Development
In 2019–2020, staff conducted an analysis to evaluate the difficulty of testlets designed with two types of engagement activities: story-based and non-story-based. As described in Chapter 3 of the 2015–2016 Technical Manual—Science (Dynamic Learning Maps Consortium, 2017), all science testlets begin with an engagement activity intended to “increase access for this student population by setting the context, activating prior knowledge, and increasing student interest” (page 42). An engagement activity may also include a science story that incorporates a science and engineering practice (SEP) and provides a real-world context or experiment that is referenced throughout the testlet. Modeled after DLM English language arts engagement activities, the science story walks the fictional student through an experiment or activity with items embedded throughout the process. Science stories often involve scaffolding of content, or breaking down a concept into smaller parts, in order to make content more accessible. At the Precursor and Target linkage levels, it is the item writer’s prerogative to create testlets with standard engagement activities or science-story based engagement activities. Regardless of the EEs or domains, when item writers were able to develop a relevant and useful science story for a particular EE at the Precursor or Target linkage levels, they were encouraged to do so. Initial level testlets were excluded because they present an engagement activity designed specifically for teacher-administered testlets. They consist of a set of directions for the educator that outline steps to take when introducing the student to the pictures or objects that will be used. Thus, it was expected story-based engagement activities would be distributed across the EEs at the Target and Precursor levels and that that the two types of testlets would perform similarly (i.e., be of similar difficulty) across grade bands.
To evaluate potential effects of the two different types of science testlet engagement activities on testlet performance, ATLAS science test development staff first determined an operational definition for what constitutes a science story versus a non-science story engagement activity (herein referred to as just as “engagement activity”). Science stories require the use of multiple screens to provide the context for the experiment or activity because DLM test development guidelines limit the amount of text on any given screen. Standard engagement activities only require limited text to set the needed context. A heuristic was used to differentiate science stories from non-science story engagement activities. Specifically, science stories were defined by the use of two or more contextual screens (i.e., screens that do not present test items). Engagement activities were defined by the use of only one engagement screen prior to test items.
A total of 95 testlets were coded for this study. This sample constituted the entire operational pool for Precursor and Target linkage level testlets. Using the operational definitions of science story and engagement activity, two science test development team members independently categorized 10 of 95 (11%) testlets across all grade bands and linkage levels either as a science story or engagement activity. They agreed on four (40%) of their ratings; they then discussed each testlet on which they disagreed, reviewed the definitions and their rationales for their ratings, and subsequently came to consensus ratings on the remaining 60% of testlets where they had initially disagreed The majority of disagreements were on testlets that used two screens to set the context prior to the test items; discussion focused on whether or not the coding definitions required revision. After discussion, it was determined that the two-screen activities sufficiently established a science story and thus no changes to the operational definition was needed.. They rated another 14 testlets (15%) independently and agreed on 100% of their ratings. After this step, one person rated the remaining 71 testlets.
In order to examine the effects of science testlet features on testlet performance, we compared the differences in the weighted mean item difficulty (p-values) of science story testlets versus testlets with only engagement activities, weighted by each item’s sample size. Table 3.1 presents the weighted p-values for each category of testlets by grade band and linkage level. The weighted item p-values for science story testlets and engagement activity testlets were similar across grade bands and Precursor and Target linkage levels, with the largest difference in weighted p-values of 0.139 found in middle school at the Target linkage level. The engagement activity testlets tended to be slightly easier in each grade band and linkage level with the exception of the Target level in high school.
While the results generally indicate that testlets that use science stories versus engagement activities perform similarly in terms of average item difficulty, engagement activity testlets may be slightly easier than the science story testlets. However, results should be interpreted with caution. Because of adaptive routing, students take items at different linkage levels across the Essential Elements (EEs). Furthermore, p-values are sample dependent and are not directly comparable to one another; that is, fluctuations in p-values may be due to fluctuations in the samples of students taking the items.
|
N of Students
|
|||||||||
|---|---|---|---|---|---|---|---|---|---|
| Grade Band | Linkage Level | Testlet Type | Min | Max | Median | N of Testlets | N of Items | Weighted Mean | Standard Deviation |
| Elementary | Precursor | EA | 3,566 | 11,118 | 4,191 | 8 | 32 | .581 | .095 |
| SS | 2,941 | 9,679 | 4,786 | 10 | 40 | .570 | .089 | ||
| Target | EA | 2,319 | 12,731 | 8,058 | 4 | 12 | .735 | .145 | |
| SS | 4,090 | 9,750 | 6,808 | 5 | 15 | .722 | .141 | ||
| Middle | Precursor | EA | 3,731 | 8,120 | 5,518 | 10 | 36 | .662 | .088 |
| SS | 88 | 12,287 | 4,156 | 9 | 39 | .584 | .090 | ||
| Target | EA | 6,915 | 16,249 | 10,494 | 6 | 18 | .745 | .123 | |
| SS | 4,506 | 9,996 | 9,498 | 3 | 9 | .606 | .172 | ||
| High | Precursor | EA | 59 | 7,995 | 2,516 | 8 | 25 | .632 | .144 |
| SS | 99 | 14,813 | 4,196 | 16 | 66 | .586 | .076 | ||
| Target | EA | 84 | 11,366 | 136 | 6 | 19 | .653 | .201 | |
| SS | 85 | 11,958 | 8,060 | 10 | 32 | .716 | .102 | ||
| Note. EA = Engagement Activity; SS = Science Story; N of Testlets refers to the number of testlets included in each analysis; N of Students is the range of sample sizes across all of the items within the testlets included in each analysis. | |||||||||
3.1.2 Item Writing
For the 2019–2020 year, items were written to replenish the pool of test content. The item writing process for 2019–2020 began with an on-site event in January 2020. Following this initial event, item writing continued remotely via a secure online platform until the end of June 2020. A single pool of item writers was trained to write single-Essential Element (EE) testlets to expand the operational pool.
A total of 292 single-EE testlets were written for science.
3.1.2.1 Item Writers
An item writer survey was used to collect demographic information about the teachers and other professionals who were hired to write DLM testlets. In total, 37 science item writers contributed to writing testlets for the 2019–2020 year. The median and range of years of teaching experience of the item writers is shown in Table 3.2. The median years of experience was at least 3.5 years for item writers of science testlets in pre-K–12, special education, and science.
| Area | Median | Range |
|---|---|---|
| Pre-K–12 | 9.5 | 0–26 |
| Science | 8.5 | 0–26 |
| Special Education | 3.5 | 0–22 |
The level and types of degrees held by item writers are shown in Table 3.3 and Table 3.4, respectively. All item writers who completed the demographics survey held at least a bachelor’s degree, with the most common field of study being content specific (n = 9; 30%), followed by education (n = 7; 23%). A majority (n = 26; 87%) also held a master’s degree, for which the most common field of study was special education (n = 9; 35%).
| Degree | n | % |
|---|---|---|
| Bachelor’s | 30 | 81.1 |
| Master’s | 26 | 70.3 |
| Missing | 7 | 18.9 |
| Degree | n |
|---|---|
| Bachelor’s Degree | |
| Education | 7 |
| Content Specific | 9 |
| Special Education | 4 |
| Other | 4 |
| Missing | 6 |
| Master’s Degree | |
| Education | 6 |
| Content Specific | 3 |
| Special Education | 9 |
| Other | 8 |
| Missing | 0 |
Item writers reported a range of experience working with students with different disabilities, as summarized in Table 3.5. Teachers collectively had the most experience working with students with an emotional disability, a specific learning disability, a mild cognitive disability, multiple disabilities, or other health impairments.
| Disability Category | n | % |
|---|---|---|
| Blind/Low Vision | 6 | 16.2 |
| Deaf/Hard of Hearing | 9 | 24.3 |
| Emotional Disability | 20 | 54.1 |
| Mild Cognitive Disability | 17 | 45.9 |
| Multiple Disabilities | 17 | 45.9 |
| Orthopedic Impairment | 9 | 24.3 |
| Other Health Impairment | 17 | 45.9 |
| Significant Cognitive Disability | 15 | 40.5 |
| Specific Learning Disability | 20 | 54.1 |
| Speech Impairment | 16 | 43.2 |
| Traumatic Brain Injury | 8 | 21.6 |
| Not reported | 14 | 37.8 |
3.1.2.2 The Cognitive Process Dimension in Item Writing
For the 2020 item writing cohort, an increased focus was given to the DLM science cognitive process dimensions and the process through which they are assigned to science assessment items. The purpose of the increased focus was to ensure improved understanding around assigning CPD to items as well as alignment between items and the CPD in such a way that the item development itself was improved. The rationale for this decision is that with improved understanding of the cognitive load put on students by an item, DLM item writers can more mindfully craft questions to elicit the intended response from students.
By spotlighting CPD during the onsite item writing event, DLM science staff sought to meet three goals for panelists: a more grounded understanding in how CPD interacts with science items, an understanding of how to write items with the CPD in mind, and increased confidence from item writers in assigning the CPD of items once the remote phase of item writing commenced. In order to meet these goals, efforts of the test development team centered around deepening panelist understanding of the preexisting materials surrounding the science-specific CPD and increased context around the multidimensionality of a science testlet. Lastly, a guided practice was conducted with panelists during which they applied a CPD and their rationale to several example items.
First, the onsite training devoted more time to science-specific CPD materials. Elaboration on the creation and proper definitions of CPD terms behind these materials allowed panelists familiarity to improve significantly. Second, panelists received thorough explanation of the historical context around science’s three linkage levels and the multi-dimensional nature in relation to NGSS. With these considerations in mind, item writer’s misconceptions around how to assess science concepts also improved. Lastly, a guided session devoted to the practice of assigning CPD to preplanned items took place to provide an opportunity for panelists to be supported in the early stages of the process. During the guided practice, DLM staff led panelists through sample items alongside the materials that they rely on during the remote phase of item writing. After allotted independent practice time, transparent discussion took place regarding the CPD selected by panelists and the correct CPD identified by DLM staff. Any remaining misconceptions held by the item writers were fielded in an open dialogue between DLM staff and panelists.
3.2 External Reviews
The purpose of external review is to evaluate items and testlets developed for the DLM Alternate Assessment System. Using specific criteria established for DLM assessments, reviewers decided whether to recommend that the content be accepted, revised, or rejected. Feedback from external reviewers is used to make final decisions about assessment items before they are field-tested.
The process for external review in 2019–2020 was updated from external reviews in the previous three review cycles. Changes included hosting a hybrid event, with both online training and an on-site event and updating the training process and resources for external reviewers.
3.2.1 Review Recruitment, Assignments, and Training
At the end of March 2020, a voluntary survey was used to recruit external review panelists. Candidates for the external review process completed a Qualtrics survey to capture demographic information as well as information about their education and work experience. The candidates were screened by the implementation and test development teams to ensure they qualified. Recruitment data were then used to identify panel types (content, bias and sensitivity, and accessibility) for which the candidate would be eligible. The test development team looked at certifications and years of teaching and balanced selections to the greatest extent possible across grade level experience, state of residence, diversity, and population density. All panelists had at least three years of teaching experience.
Each reviewer was assigned to one of the three panel types. There were 26 science reviewers: eight on accessibility panels, 15 on content panels, and three on bias and sensitivity panels.
Panelists completed six to 12 rounds of reviews, depending on which panel they served. Each round consisted of a collection of testlets that ranged from seven testlets to 15 testlets, dependent on the panel type. Content panels had the smallest number of testlets per collection, and bias and sensitivity panels had the largest number of testlets per collection.
The professional roles reported by the 2019–2020 reviewers are shown in Table 3.6. Roles included teachers, instructional coaches, and district staff. Reviewers who reported “other” roles included, program coordinators, process coordinators, supervisors of instruction, and individuals identifying with multiple categories.
| Role | n | % |
|---|---|---|
| Classroom Teacher | 19 | 73.1 |
| District Staff | 4 | 15.4 |
| Instructional Coach | 1 | 3.8 |
| Other | 2 | 7.7 |
Reviewers had varying experience teaching students with the most significant cognitive disabilities. Science reviewers had a median of 13.5 years of experience teaching students with the most significant cognitive disabilities, with a minimum of zero and a maximum of 38 years of experience.
Science panelists’ were from 13 different states. Population density of schools in which reviewers taught or held a position is reported in Table 3.7. Within the survey, rural was defined as a population living outside settlements of 1,000 or fewer inhabitants, suburban was defined as an outlying residential area of a city of 2,000–49,000 or more inhabitants, and urban was defined as a city of 50,000 inhabitants or more.
| Population Density | n | % |
|---|---|---|
| Rural | 9 | 34.6 |
| Suburban | 3 | 11.5 |
| Urban | 11 | 42.3 |
| Not Applicable | 3 | 11.5 |
Prior to attending the on-site external review event, panelists completed an advance training course. The course included five modules that all panelists had to complete, allowing the panelists to gain familiarity with all areas being covered. All panelists completed the following modules: DLM Overview and External Review Process, Accessibility, Bias and Sensitivity, and Content. Each content module was subject-specific, while the bias and sensitivity and accessibility modules were universal for all subjects. After each module, the panelists had to complete a quiz and receive a score of at least 80% to continue to the next module. Panelists were required to complete advance training prior to reviewing any testlets at the event.
Review of testlets was completed only during the two days of the on-site event. Due to technical issues, not all panelists had time to review as many testlets as in prior years. As a consequence, some subject rooms saw fewer testlets reviewed than others. Panelists reviewed each testlet on their own and then as a group. Each group came to a consensus for each item and testlet, and the facilitator recorded the recommendation.
3.2.2 Results of Reviews
Panelists recommended most content be accepted. For science, the percentage of items and testlets rated as accept ranged from 51% to 89% and 58% and 96%, respectively. The percentage of items and testlets rated as revise ranged from 11% to 43% and 4% to 42% respectively. The rate at which both items and testlets were recommended for rejection ranged from 0% to 8% across grades, pools, and rounds of review.
3.2.3 Test Development Decisions
Because each item and testlet was examined by three separate panels, external review ratings were compiled across panel types, following the same process as previous years. DLM test development teams reviewed and summarized the recommendations provided by the external reviewers for each item and testlet. Based on that combined information, staff had five decision options: (a) no pattern of similar concerns, accept as is; (b) pattern of minor concerns, will be addressed; (c) major revision needed; (d) reject; and (e) more information needed.
The DLM science test development team documented the decision category applied by external reviewers to each item and testlet. Following this process, the test development team made a final decision to accept, revise, or reject each of the items and testlets. The test development team made only two minor revisions to items compared to 33 major revisions to items, and rejected just one testlet. Most of the content reviewed during this external review is scheduled for the spring 2021 window.
3.3 Operational Assessment Items for 2019–2020
A total of 18,037 test sessions were administered during the spring testing window. One test session is one testlet taken by one student. Only test sessions that were complete at the close of each testing window counted toward the total sessions.
Testlets were made available for operational testing in spring 2020 based on the 2018–2019 operational pool and the testlets field-tested during 2018–2019 that were promoted to the operational pool following their review. Table 3.8 summarizes the total number of operational testlets for spring 2020 for science. There were 151 operational testlets available across grade bands and courses. This total included one EE/linkage level combination for which both a general version and a version for students who are blind or visually impaired or read braille were available.
| Grade Band or Course | n |
|---|---|
| Elementary | 42 |
| Middle School | 45 |
| High School | 43 |
| Biology | 31 |
| Note: Three EEs are shared across the high school and biology assessment. |
Similar to prior years, the proportion correct (p-value) was calculated for all operational items to summarize information about item difficulty.
Figure 3.1 shows the p-values for each operational item in science. To prevent items with small sample sizes from potentially skewing the results, the sample size cutoff for inclusion in the p-value plots was 20. The p-values for most science items were between .4 and .7.
(ref:sample-size-note) Note. Items with a sample size of less than 20 were omitted.
Figure 3.1: p-values for science 2020 operational items.
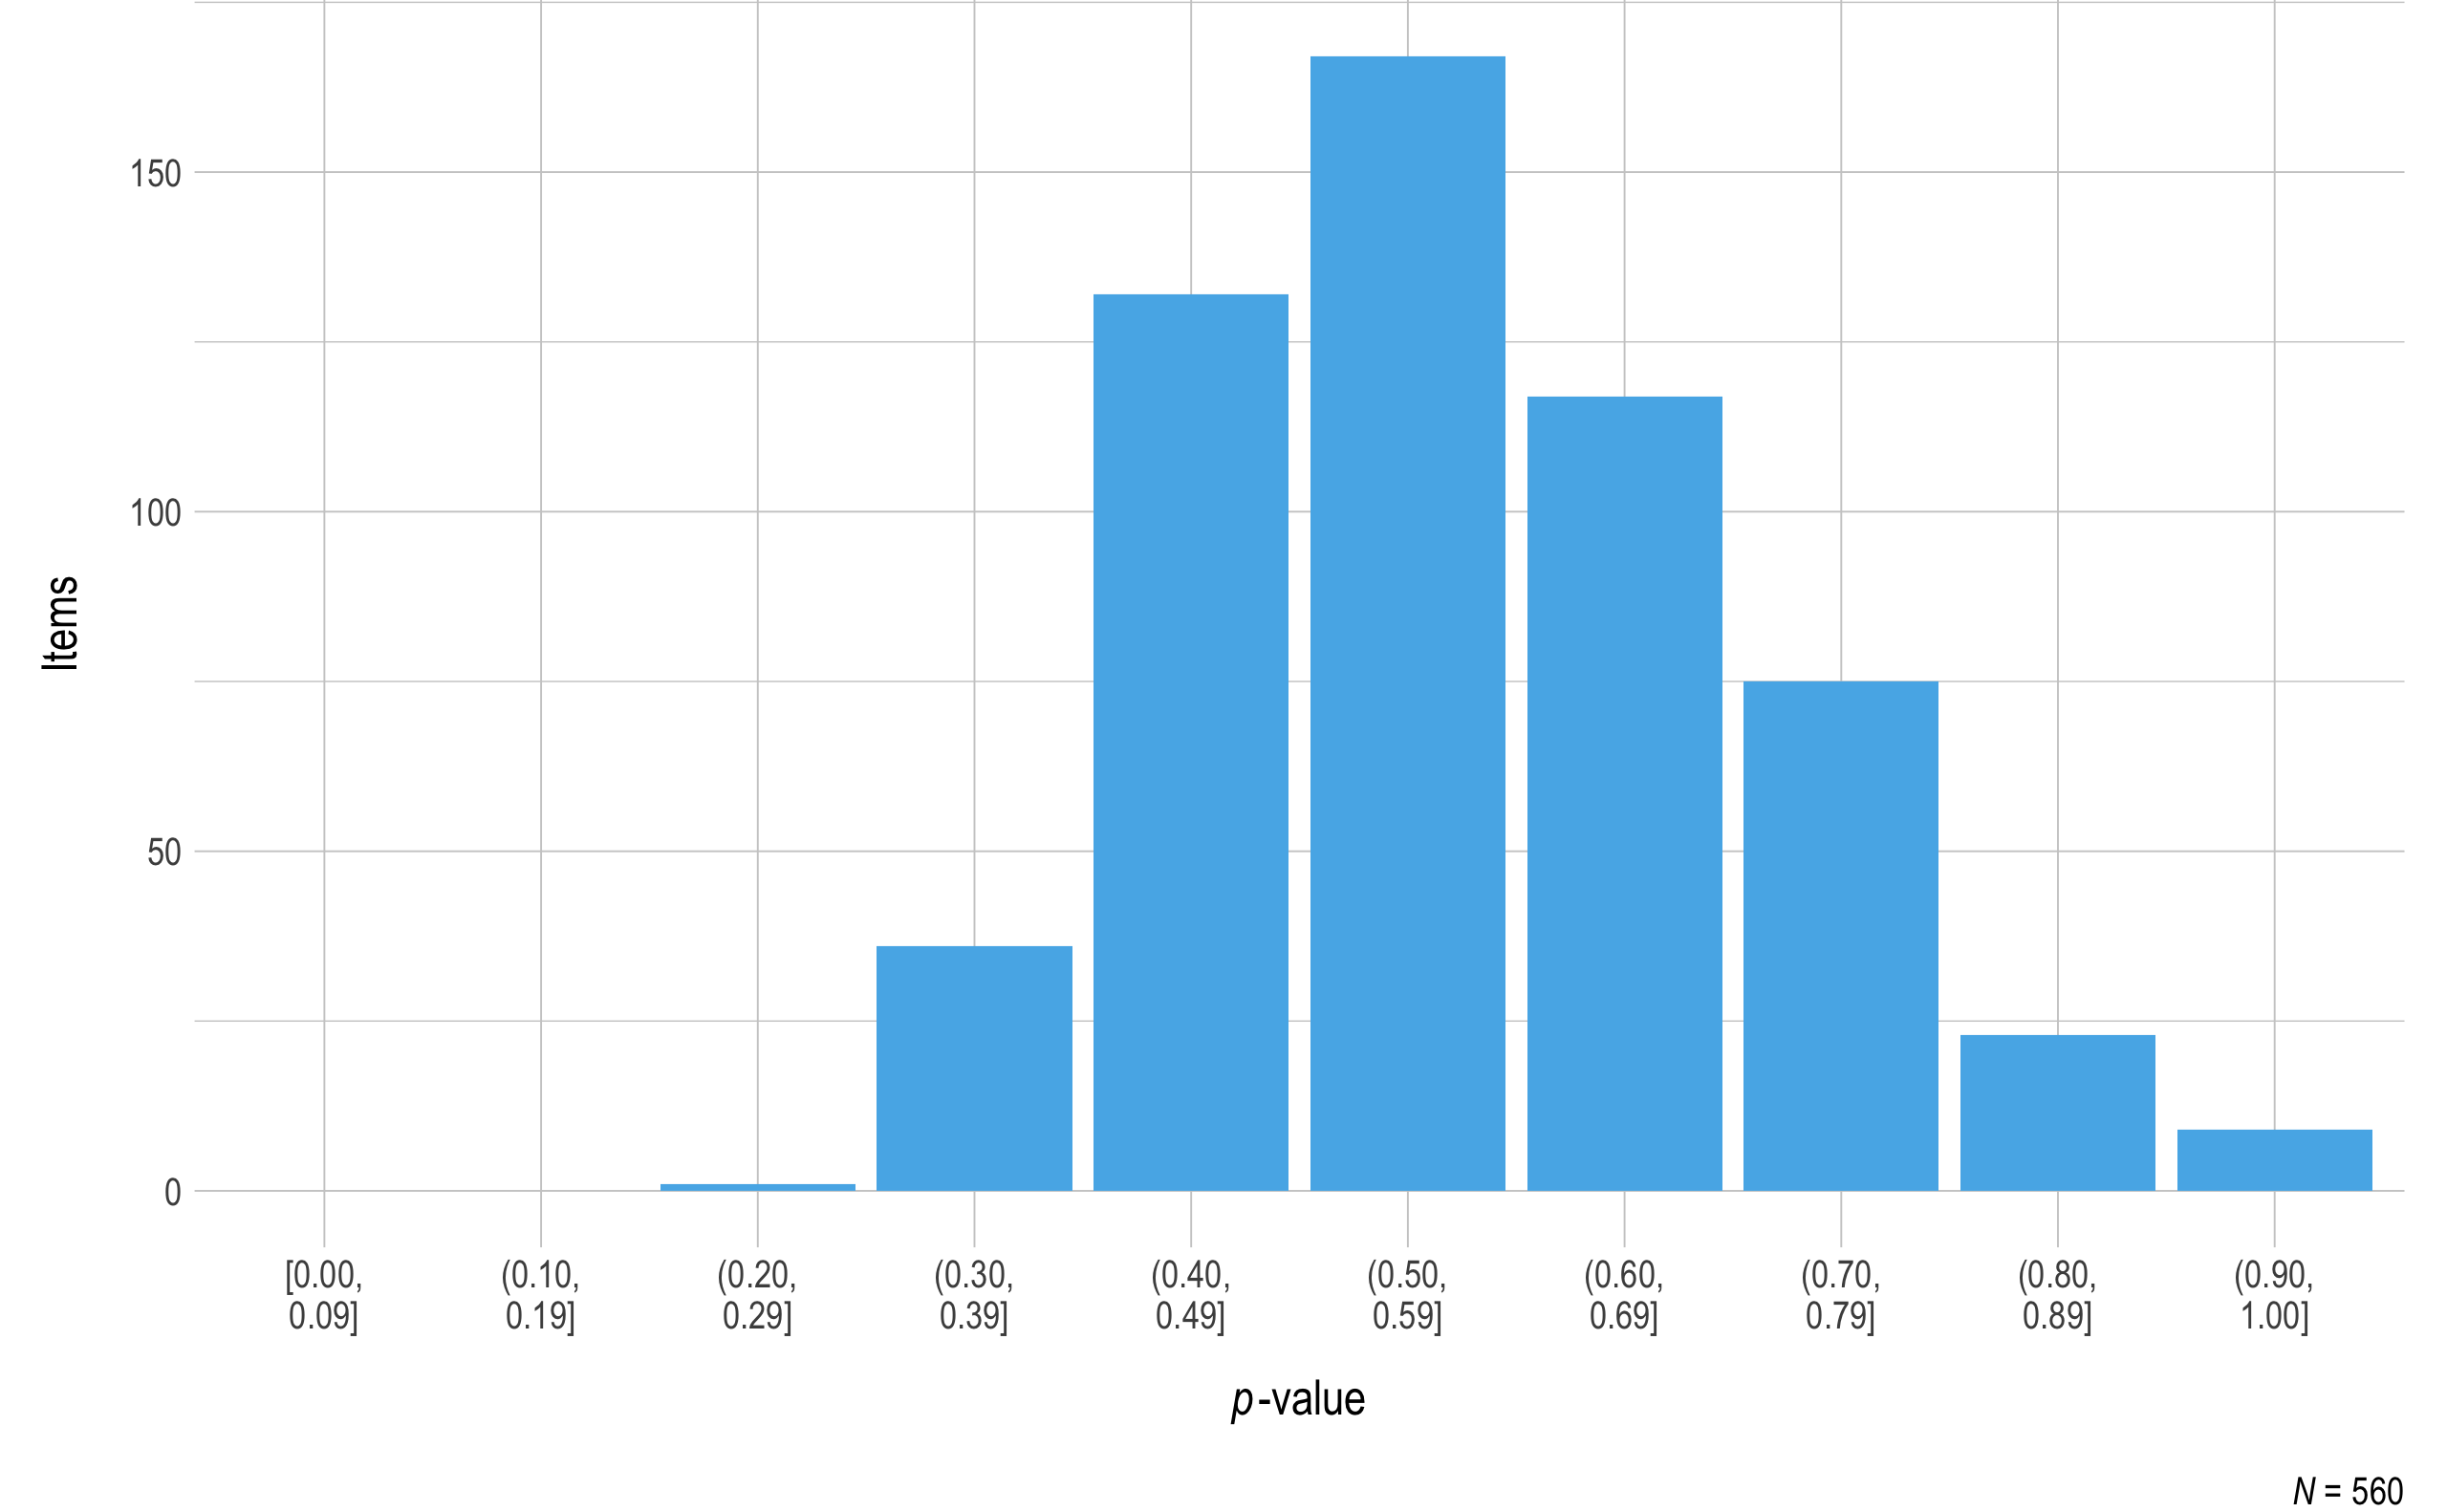
(ref:sample-size-note)
Standardized difference values were also calculated for all operational items with a student sample size of at least 20 required to compare the p-value for the item to all other items measuring the same EE and linkage level. The standardized difference values provide one source of evidence of internal consistency. See Chapter 9 in this manual for additional information on internal consistency with linkage levels.
Figure 3.2 summarizes the standardized difference values for operational items for science. All items fell within two standard deviations of the mean of all items measuring the EE and linkage level. As additional data are collected and decisions are made regarding item pool replenishment, test development teams will consider item standardized difference values when determining which items and testlets are recommended for retirement.
Figure 3.2: Standardized difference z-scores for science 2020 operational items.
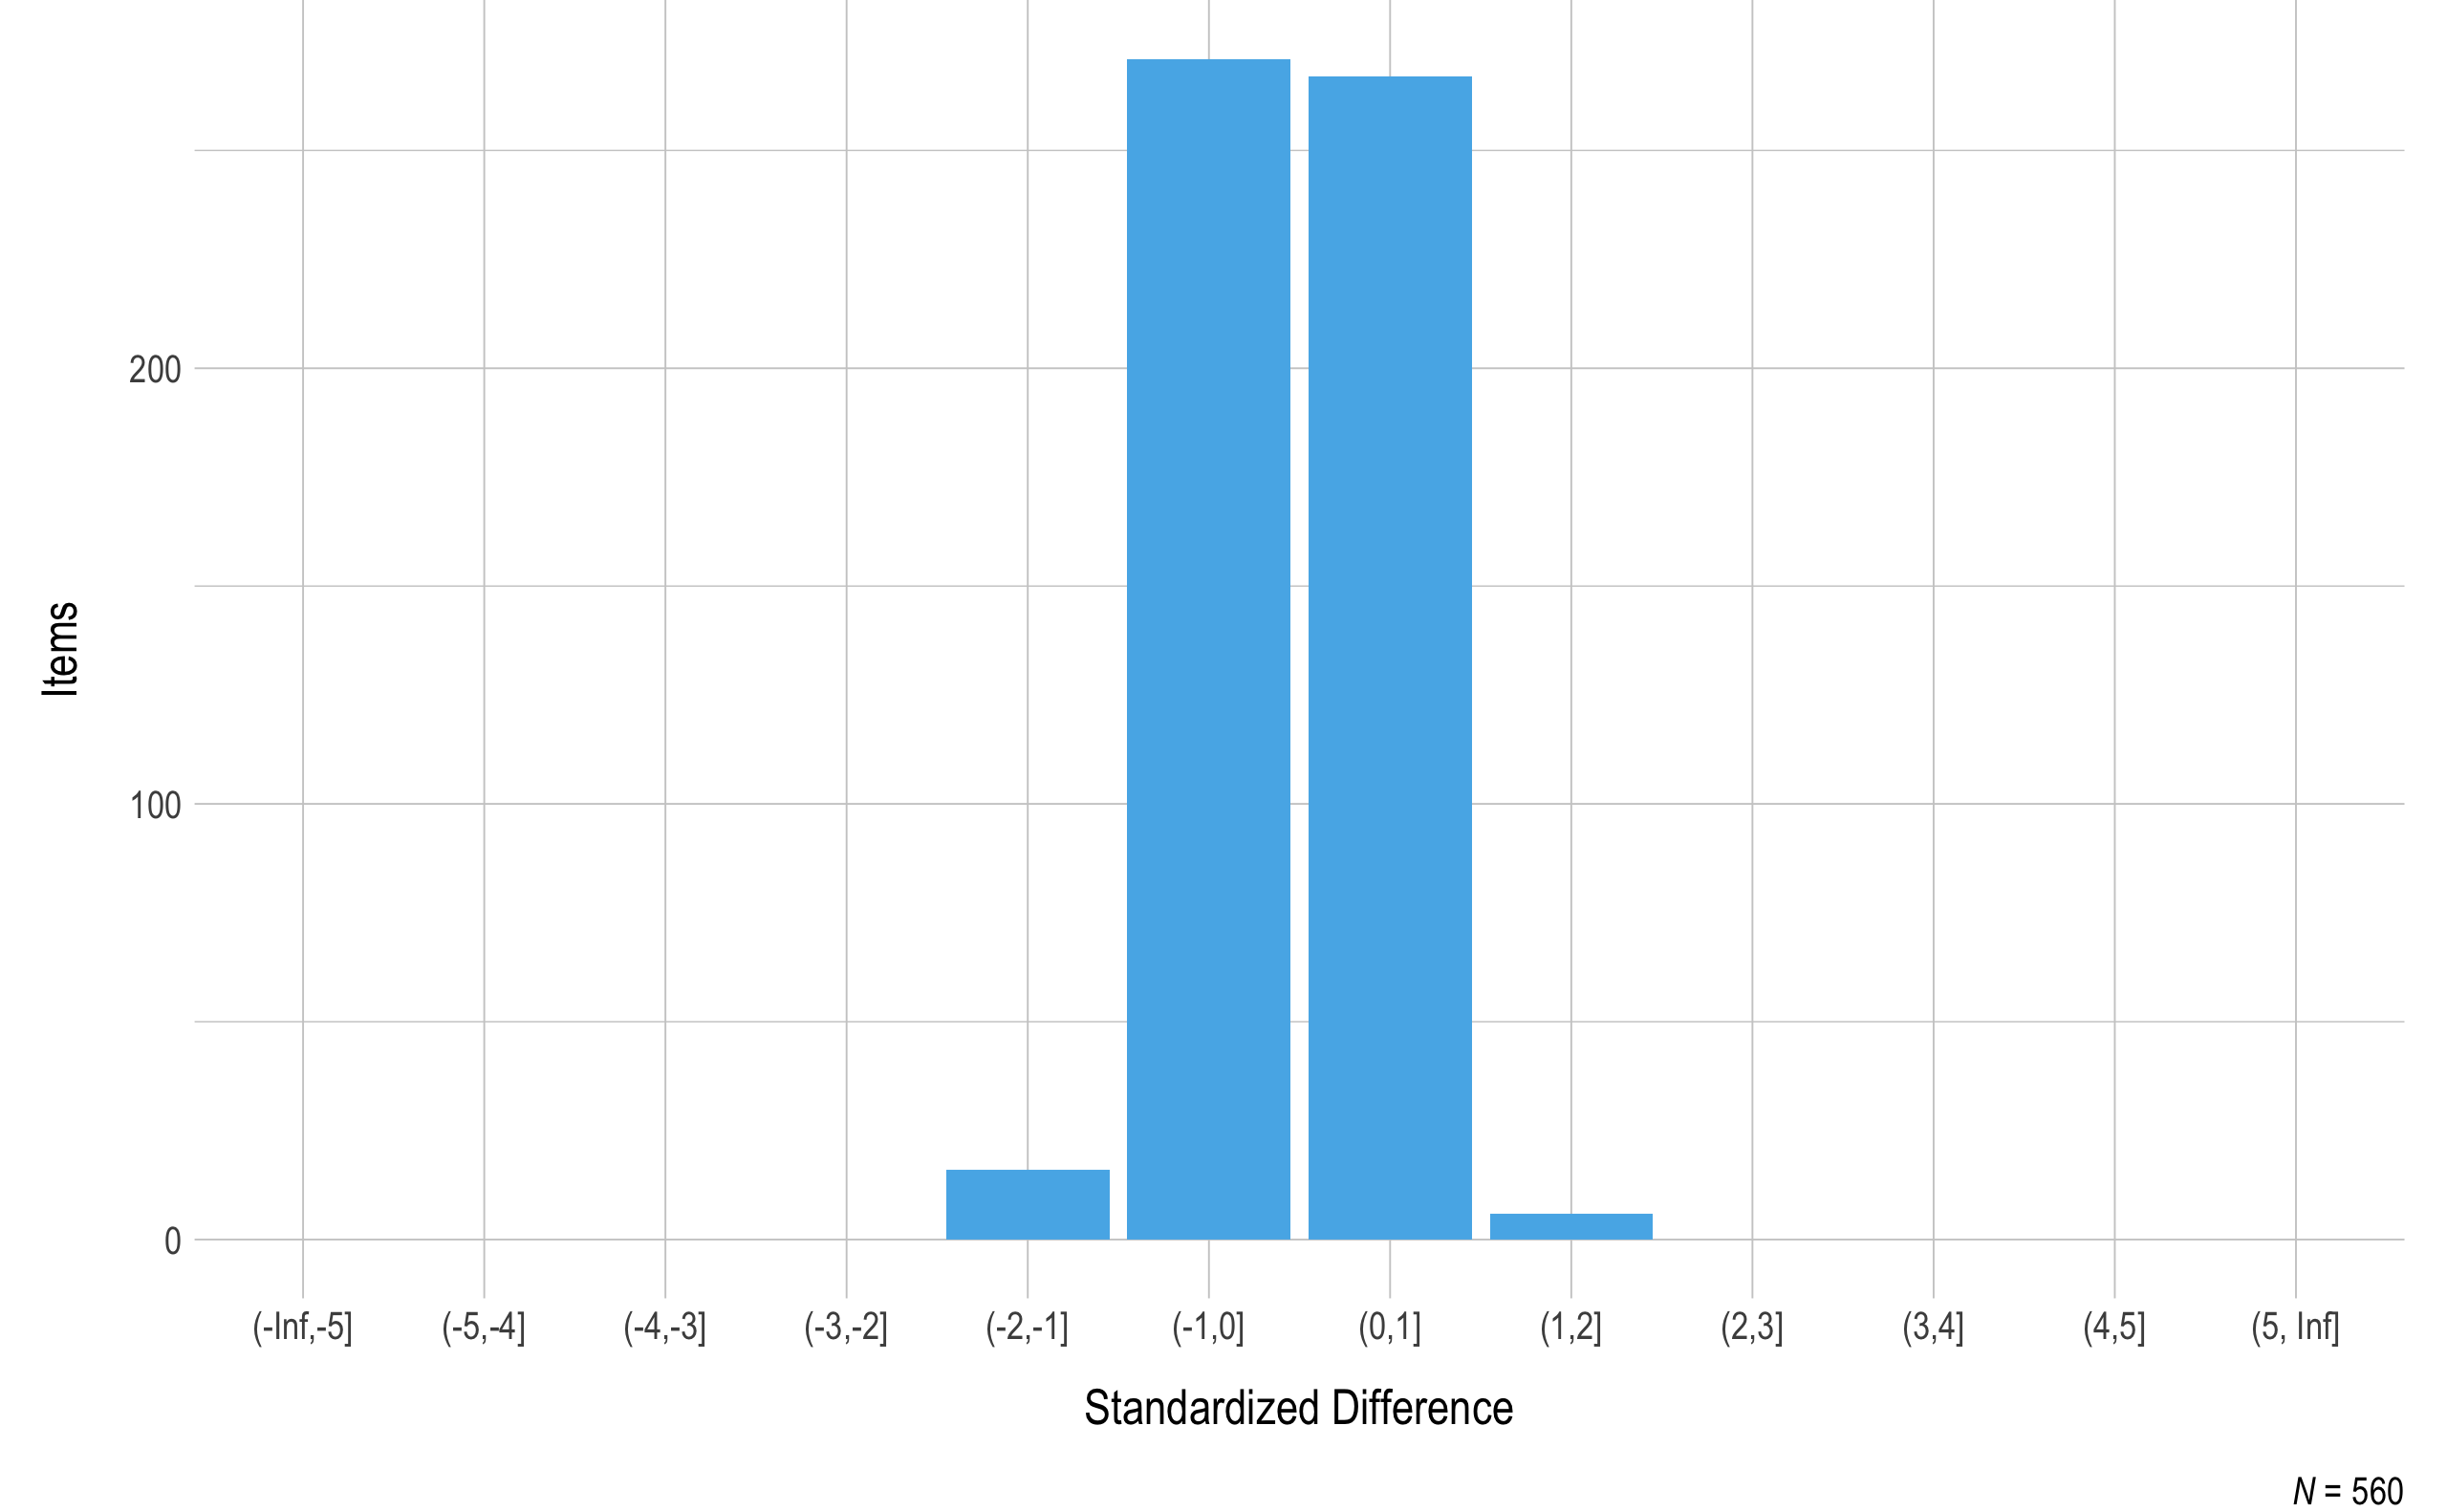
(ref:sample-size-note)
3.4 Field Testing
During the 2019–2020 academic year, DLM field tests were administered to evaluate item quality for EEs assessed at each grade level for science. Field testing is conducted to deepen operational pools so that multiple testlets are available in the spring window, including making more content available at EEs and linkage levels that teachers administer to students the most. By deepening the operational pool, testlets can also be evaluated for retirement in instances where other testlets perform better.
A summary of prior field test events can be found in Summary of Results from the 2014 and 2015 Field Test Administrations of the Dynamic Learning Maps Alternate Assessment System (Clark, Karvonen, et al., 2016), and in Chapter 3 of the 2015–2016 Technical Manual—Science (Dynamic Learning Maps Consortium, 2017) and subsequent annual DLM technical manual updates.
3.4.1 Description of Field Tests
Field tests were administered following completion of the operational assessment in the spring. Following completion of blueprint coverage requirements in science, a field test testlet was assigned for an EE that was assessed during the operational assessment at a linkage level equal or adjacent to the linkage level of the operational testlet. Adjacent linkage level assignment helps ensure both masters and non-masters complete the field test testlet, providing better psychometric data for item review. Additionally, adjacent linkage level data helps support future modeling work (see Chapter 5 of this manual).
Testlets were made available for spring field testing in 2019–2020 based on the availability of field test content for each EE/linkage level. Table 3.9 summarizes the total number of field test testlets by grade level for 2019–2020. A total of 131 field test testlets were available across grades.
| Grade | n |
|---|---|
| Elementary | 44 |
| Middle School | 45 |
| High School | 42 |
Participation in spring field testing was not required in any state, but teachers were encouraged to administer all available testlets to their students. The COVID-19 pandemic impacted field testing administration in the spring, and as a result, most students did not complete all testlets. In total, 561 (13%) students took at least one field test form. No field test testlets in the spring had a sample size of at least 20 students. These testlets will be re-field tested in the upcoming 2020–2021 year.
3.5 Conclusion
During the 2019–2020 academic year, the test development teams conducted events for both item writing and external review. Overall, 292 testlets were written for science. Additionally, following external review, all but one science testlet were retained with no or minor changes. Of the content already in the operational pool, most items had p-values within two standard deviations of the mean for the EE and linkage level. Field testing in 2019–2020 focused on collecting data from students on new content to refresh the operational pool of testlets.